The first results we’d like to highlight were collected from the Skärgårdscentrum Korpoström with the help of the Knattelabbet.
To help you compare 2025 with previous years, we’ve also included temperature curves from past years, measured at Skärgårdscentrum Korpoström.
Some details:
The heatwave lasted for 27 days (from 16.7.2025 to 11.8.2025)
The maximum intensity was 6.6 °C (on 28.7.2025)
The mean intensity was 4.15 °C
The maximum temperature was 25.2 °C (on 28.7.2025)
The temperature rose very quickly! The average onset rate was about +0.5 °C/day, and the average decline rate was -0.3 °C/day.
To note, similar heatwave intensities have been recorded before, but last year it occurred during “peak” summer = which means we were really close to some thermal tolerances of organisms in the Archipelago Sea.
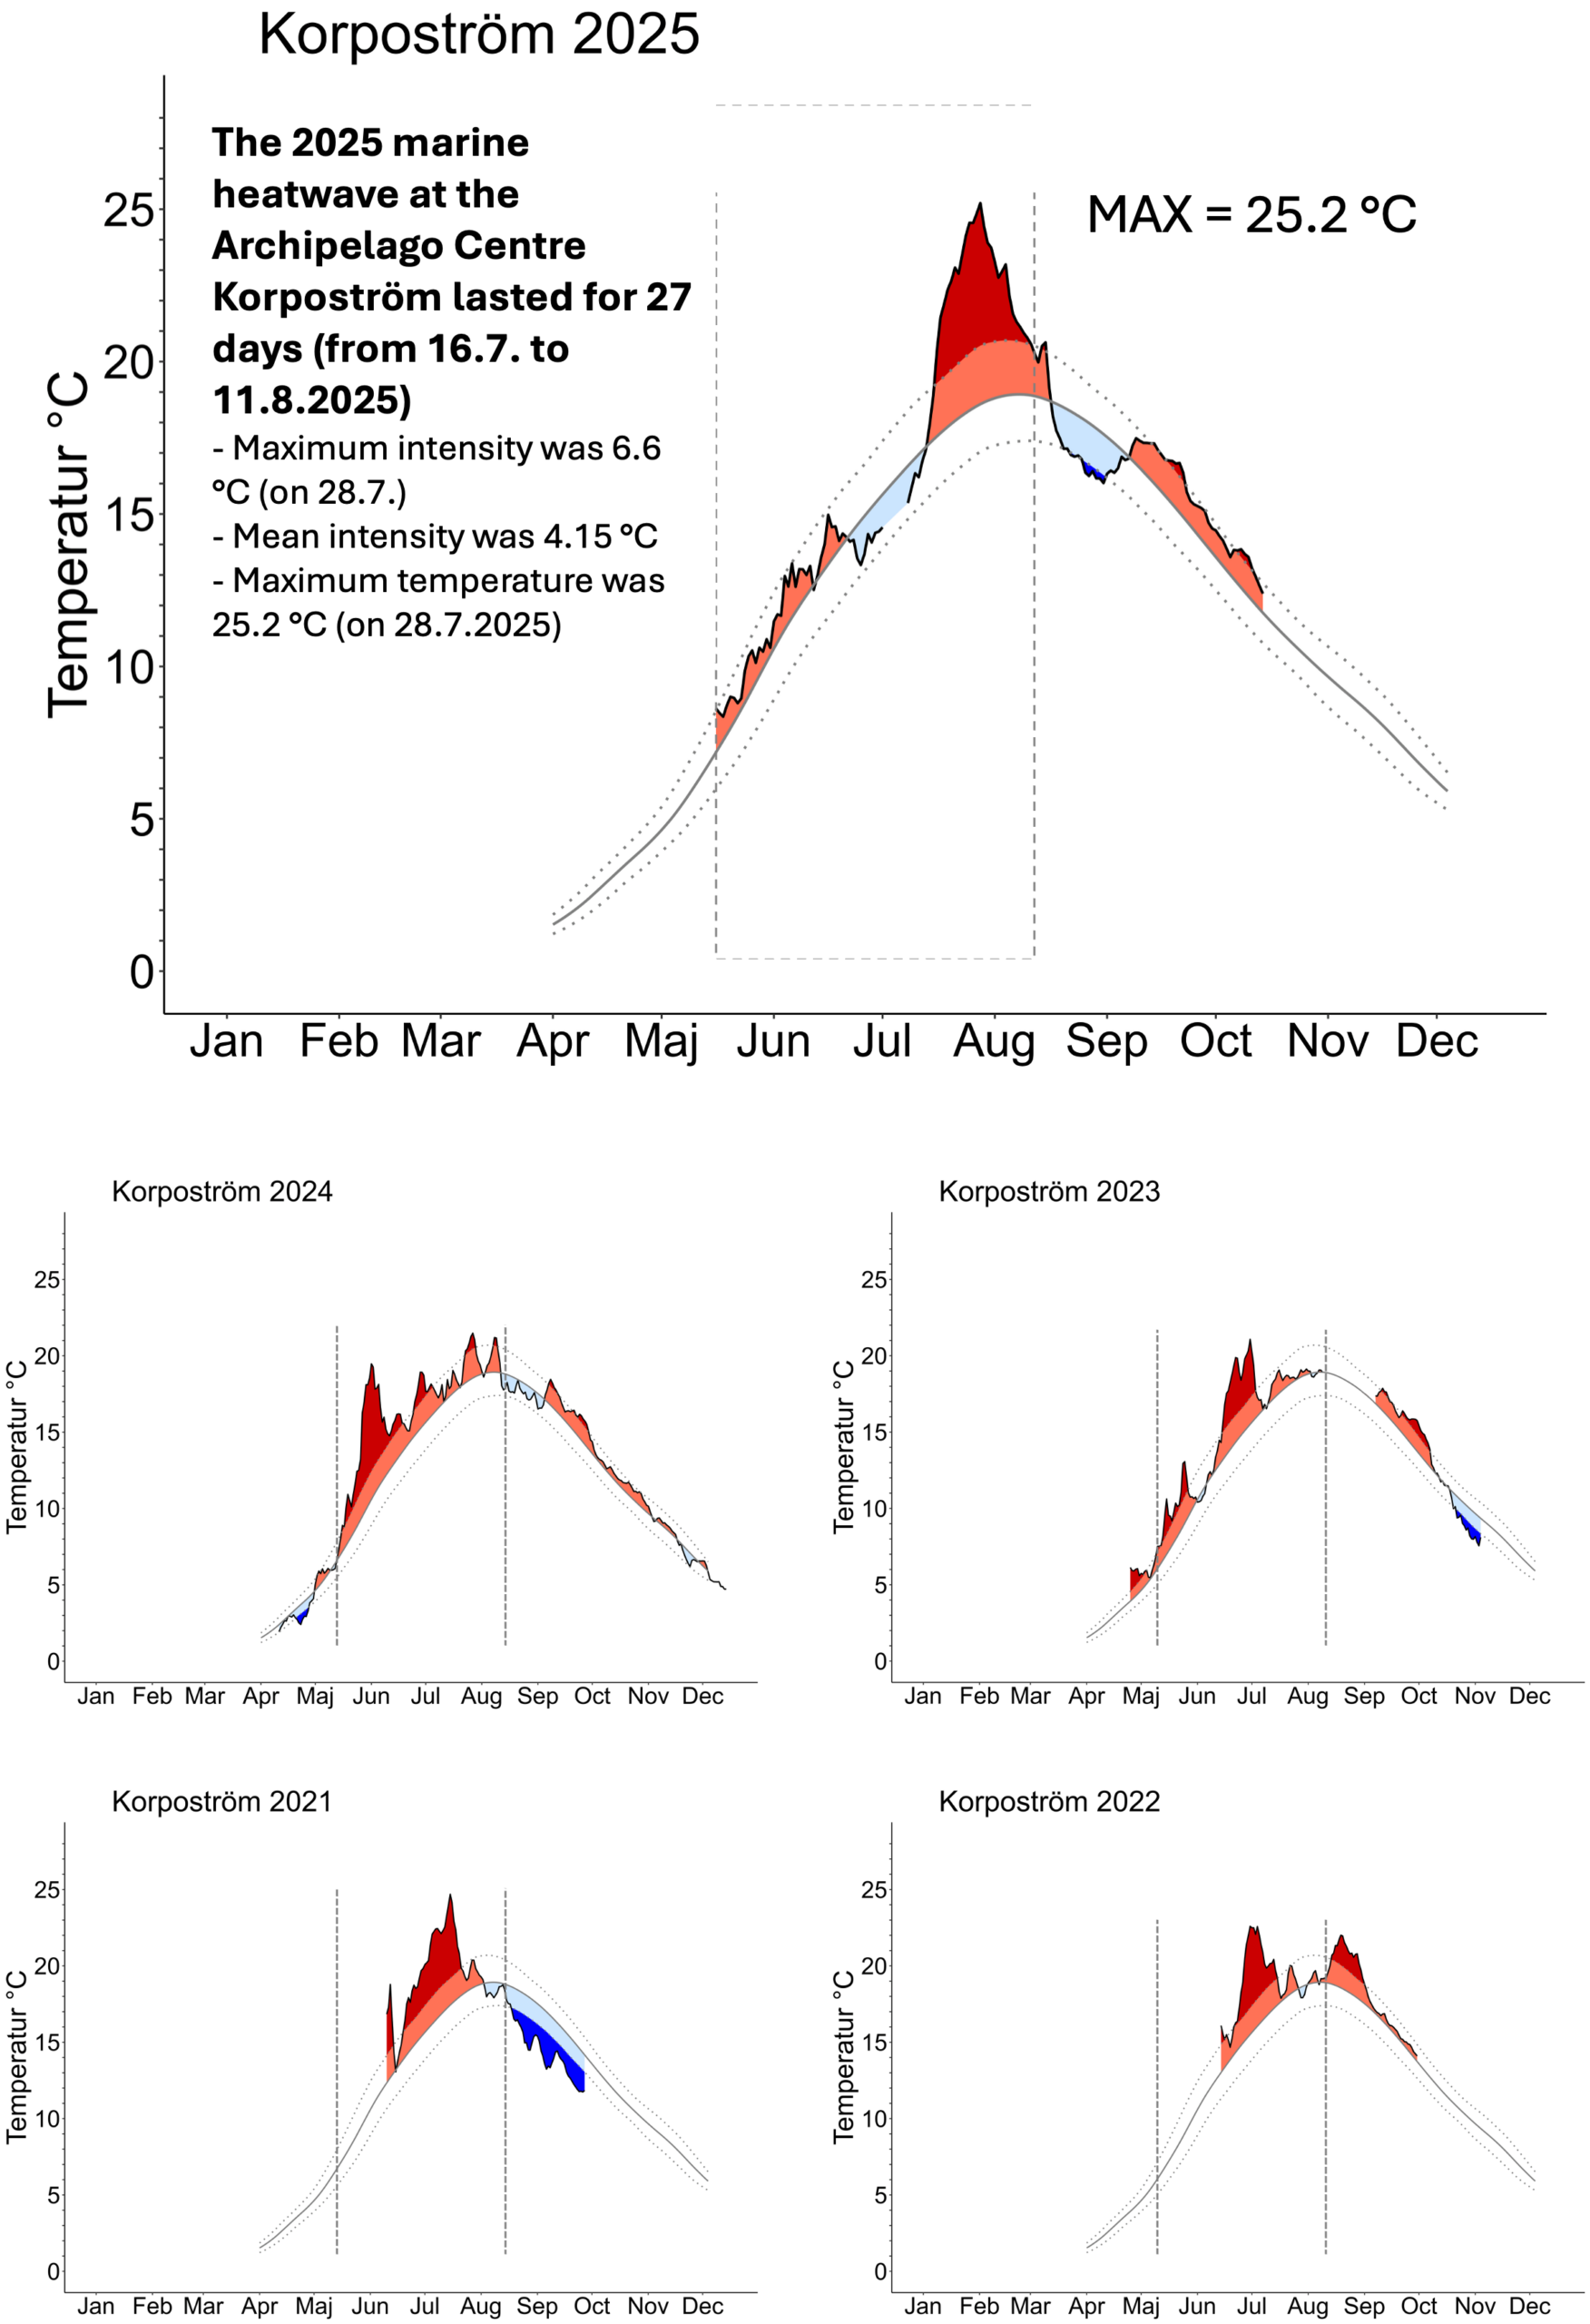
Shown are recorded temperatures (°C; solid black lines) at the Korpoström pier at 1 m depth. This dataset was analyzed on the occurrences of heatwaves and cold spells after Hobday et al. (2016), based on modelling using 2006 - 2021 climatological values from Seili at the University of Turku (grey solid line). The thresholds for heatwaves (i.e., 90th percentile) and cold-spells (i.e., 10th percentile) are represented as dotted lines. Temperatures above the climatological values, but below the 90th percentile are shown in orange, whereas temperatures above the 90th percentile are shown in red. Temperatures below the climatological trend, but above the 10th percentile are shown in light-blue, whereas temperatures below the 10th percentile are shown in dark-blue.
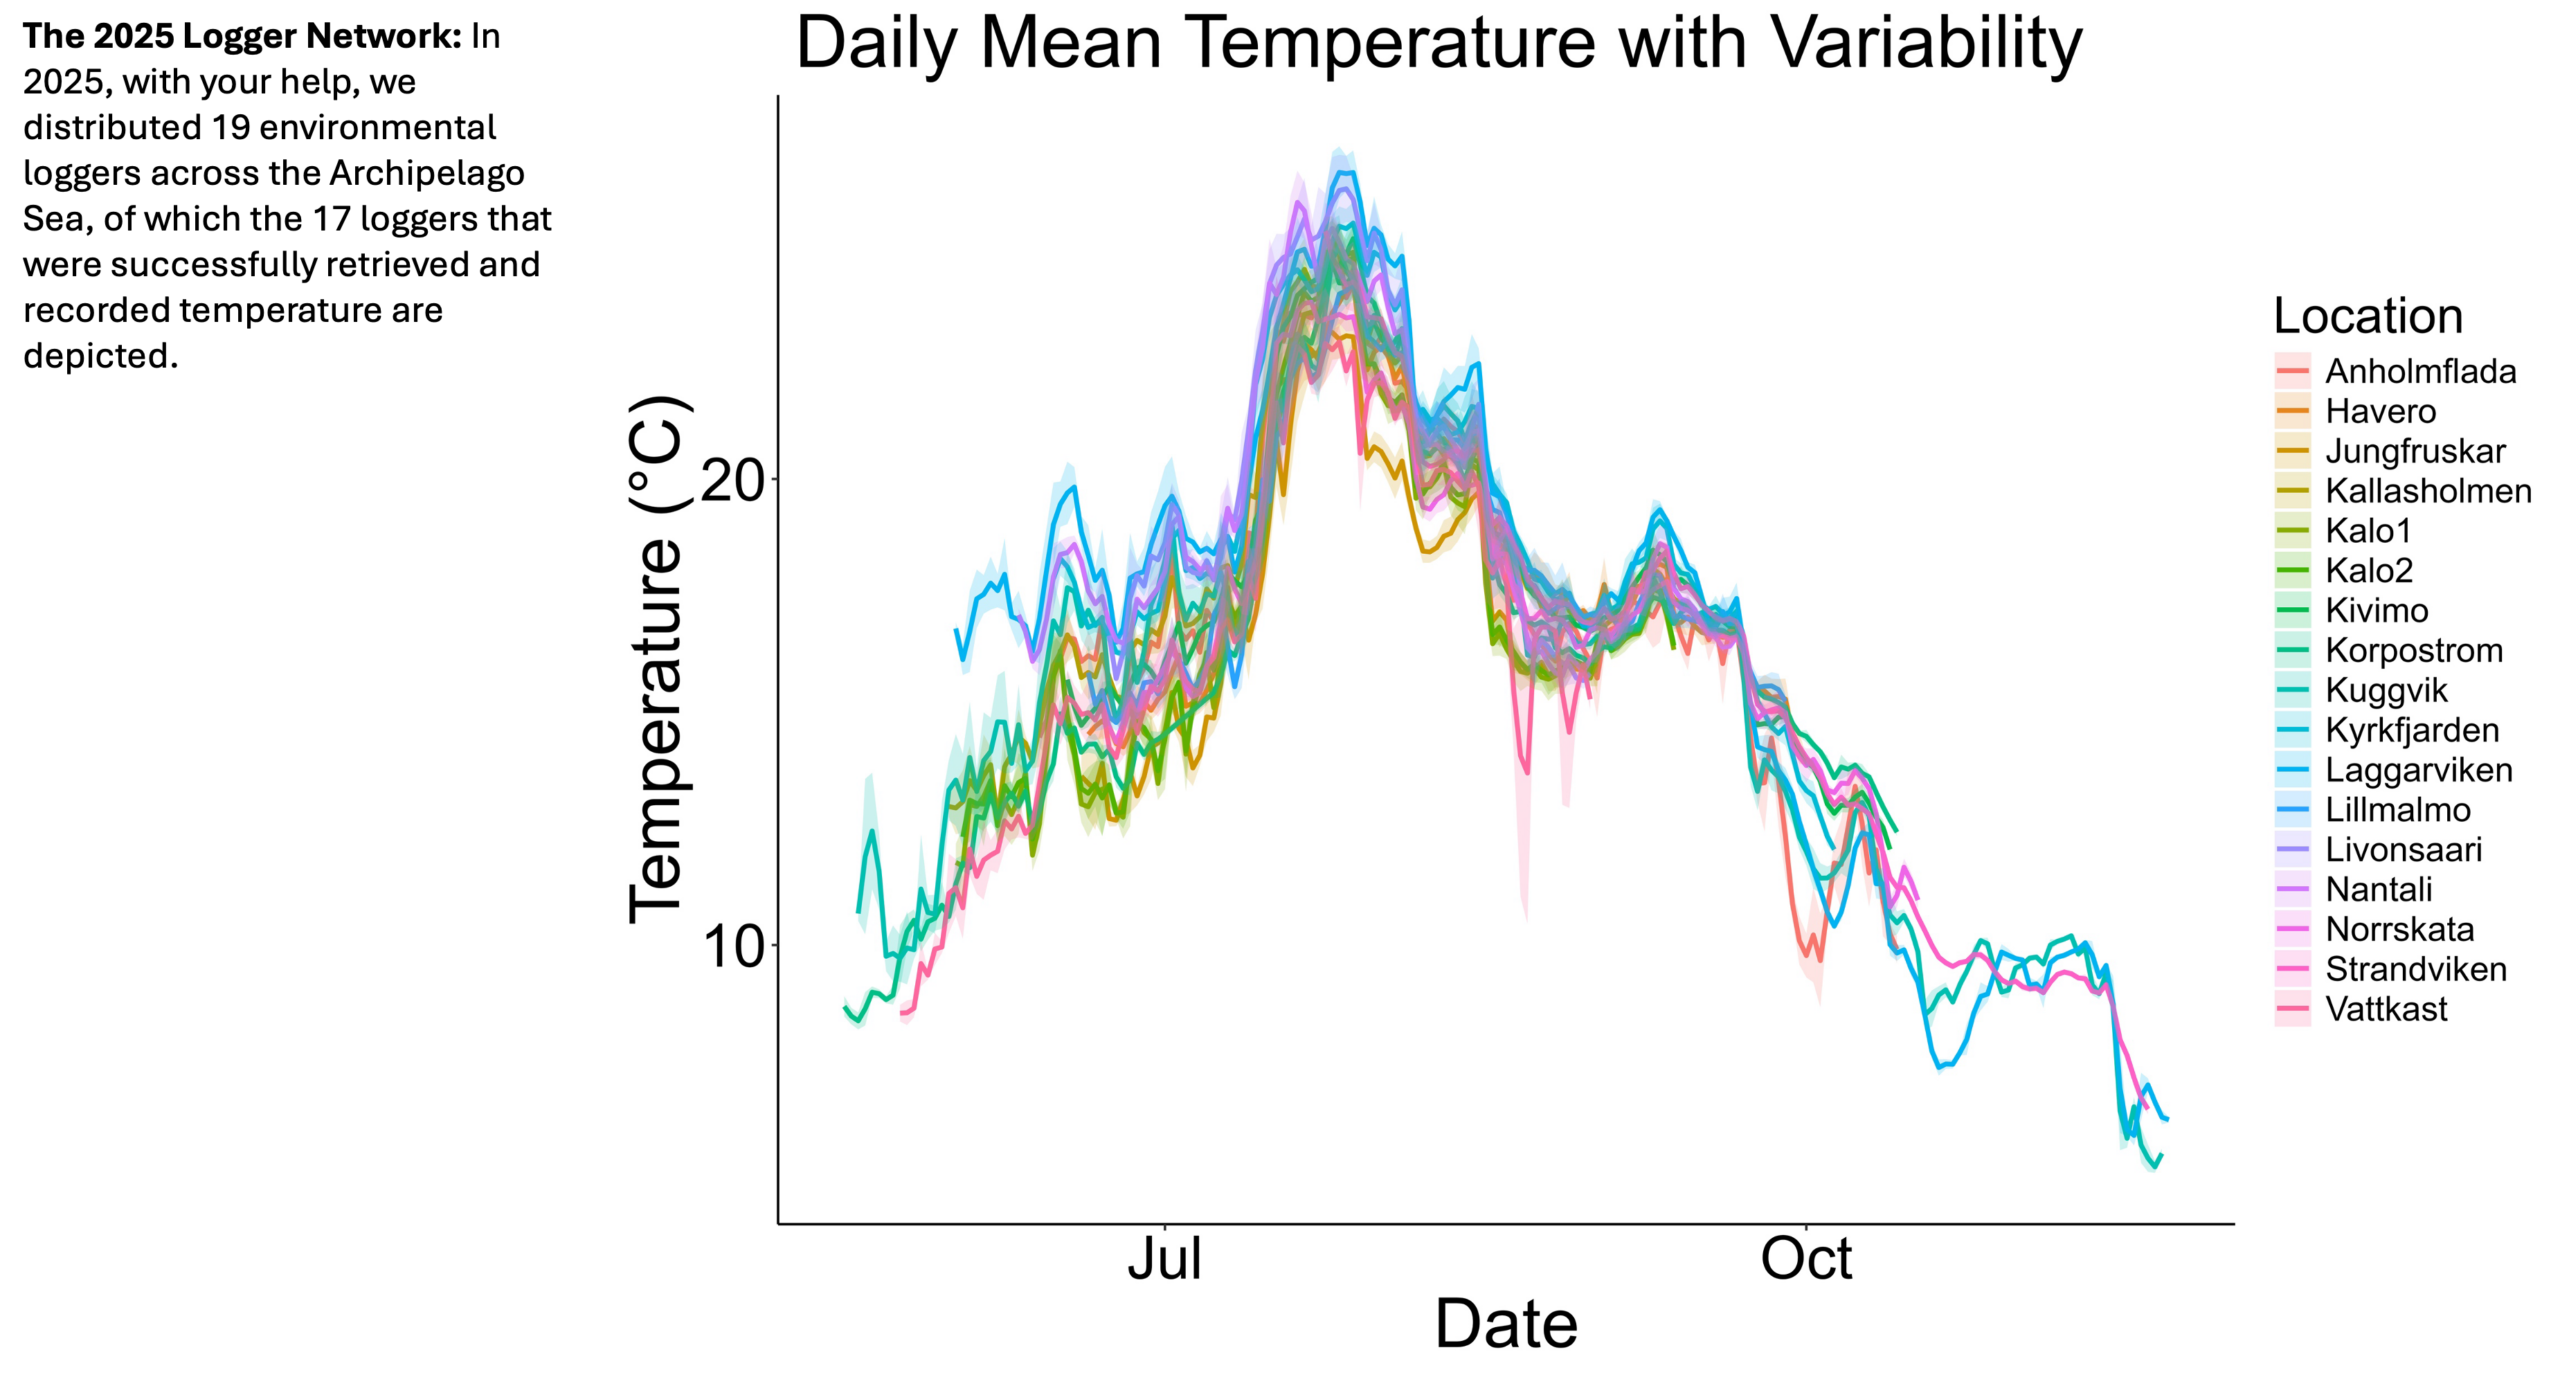
Temperature was recorded every 15 minutes during summer 2025 across the archipelago, with your help. The yellow line shows the data from Korpoström, which previously appeared quite extreme. However, when compared to all stations (grey lines), Korpoström falls within the middle range of observed temperatures. The warmest station, Laggarviken, is shown in red, and the coldest station, Jungfruskär, is shown in blue.
And More: